



Autism statistics give families a wider view than any one child’s story can. They show how common autism is and who is being diagnosed.
Most of the figures parents see in the news come from the Centers for Disease Control and Prevention (CDC). Its researchers have tracked autism in communities across the country since 2000.
This page brings the most important numbers together in one place and links to our other pages that look at specific statistics in more depth.
In this article, we’ll discuss the latest autism statistics in the United States and what they mean for families.
Key Takeaways
- About 1 in 31 U.S. 8-year-olds was identified with autism in the CDC’s 2022 surveillance data.
- Reported autism prevalence has increased substantially since 2000, influenced by changes in identification, awareness and screening.
- Autism identification varies by sex, race, ethnicity and geographic location.
- Early screening and evaluation can help families access developmental support sooner.
How Common is Autism in the United States?
About one in 31 children in the United States has been identified with autism.
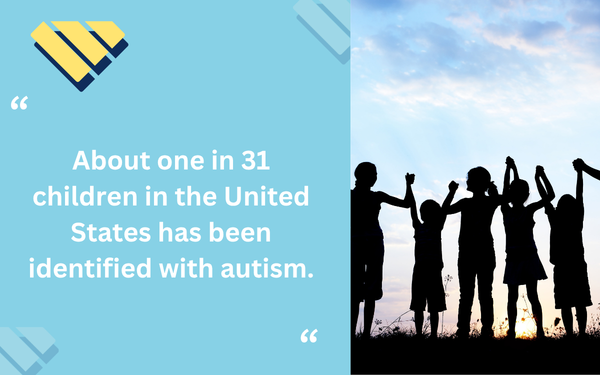
That figure comes from the CDC’s most recent report, published in April 2025, which studied 8-year-olds in 16 communities during 2022. It equals 3.2% of children that age.1
| Statistic | Latest Figure | Source |
|---|---|---|
| Children identified with autism by age 8 | 1 in 31 (3.2%) | CDC, 2022 data |
| Boys compared with girls | 3.4 times as likely to be identified | CDC, 2022 data |
| 4-year-olds identified with autism | About 1 in 34 | CDC, 2022 data |
| Median age at first diagnosis | 47 months | CDC, 2022 data |
| Children with autism who also have an intellectual disability | 39.6% | CDC, 2022 data |
| U.S. adults with autism | About 5.4 million (2.21%) | CDC estimate for 2017 |
| People with autism worldwide | About 1 in 127 | World Health Organization estimate for 2021 |
The CDC bases its figure on health and school records in the participating communities, so it isn’t a count of every child in the country. It is the most widely used estimate of how common autism is.3456
How Have Autism Rates Changed Over Time?
The share of children identified with autism has risen in nearly every CDC report since tracking began.7
| Year Studied | Children Identified with Autism |
|---|---|
| 2000 | 1 in 150 |
| 2006 | 1 in 110 |
| 2010 | 1 in 68 |
| 2014 | 1 in 59 |
| 2018 | 1 in 44 |
| 2020 | 1 in 36 |
| 2022 | 1 in 31 |
The 2022 rate was nearly five times the rate in 2000. Researchers point to several reasons for the increase. The definition of autism has broadened, pediatricians screen for it more routinely, parents and teachers know the signs better, and more communities have access to evaluations.
Who is Diagnosed with Autism?
Autism is identified in children of every background, though the rates differ from group to group.
Boys are diagnosed far more often than girls. In the CDC’s latest data, about one in 20 boys was identified with autism, compared with about one in 70 girls.2 Many researchers believe autism is missed more often in girls, which is one reason some women are diagnosed with autism later in life.
Rates also vary by race and ethnicity. For every 1,000 children in the 2022 study, autism was identified in:8
- 38.2 Asian or Pacific Islander children
- 37.5 American Indian or Alaska Native children
- 36.6 Black children
- 33.0 Hispanic children
- 31.9 multiracial children
- 27.7 white children
Earlier reports showed higher rates among white children. The change suggests that more children in groups that were once overlooked are now being evaluated.
Location matters, too. Among the 16 communities in the study, rates ranged from 9.7 per 1,000 children in Laredo, Texas, to 53.1 per 1,000 in California.9 Differences that large likely reflect how easy it is to get an evaluation in each place.
When Are Children Diagnosed with Autism?
Among children in the CDC study with a recorded diagnosis, half were first diagnosed by 47 months, just before their fourth birthday.10 About half of the children with autism had been evaluated by age 3.
Those numbers are improving. Children born in 2018 were 1.7 times as likely to be identified by age 4 as children born in 2014.11
Earlier identification matters because support can start sooner. If you have concerns about your child’s development, learning the signs and symptoms of autism is a good first step.
Autism Diagnosis and Early Identification Timeline
| Age | Developmental or Diagnostic Milestone |
|---|---|
| 18 months | Routine autism-specific screening recommended |
| 24 months | Second recommended autism-specific screening |
| By age 3 | About half of identified children had received a developmental evaluation |
| 47 months | Median age of first recorded autism diagnosis among children with a documented diagnosis |
| Age 4 | Earlier identification increasingly common in recent birth cohorts |
| Age 8 | Age used for the CDC’s headline 1-in-31 prevalence estimate |
How Many Children Born This Year Will Be Diagnosed with Autism?
About 3.6 million babies were born in the United States in 2024.12 If one in 31 of them is later identified with autism, that is roughly 117,000 children from a single year of births.
Our autism births page keeps a running estimate for the current year, in the United States and worldwide. It also breaks the numbers down by state.
These figures are projections. Most children aren’t diagnosed until several years after birth, so no one can count autism cases among newborns directly.
Where Can You Find Autism Statistics for Your State?
National numbers only tell part of the story. The CDC studies selected communities and doesn’t cover every state, so local figures come from a mix of sources.
We’ve put together a closer look at the states where Blue Gems ABA works with families:
Autism Statistics Arizona
Autism Statistics Georgia
Autism Statistics Kansas
Autism Statistics Massachusetts
Autism Statistics Missouri
Autism Statistics Nebraska
Autism Statistics New Mexico
Autism Statistics North Carolina
Autism Statistics Utah
Autism Statistics Washington DC
Each page covers how common autism is in that state, along with local trends and the services available to families there.
What Do These Numbers Mean for Families?
Statistics describe large groups, and your child is one person. They are still useful for understanding what kind of support families need.
| What the Data Shows | What It Means for Families | How Blue Gems ABA Helps |
|---|---|---|
| 1 in 31 children is identified with autism | Many families near you are on the same path | We serve families in 11 states and Washington, D.C. |
| About half of children are evaluated by age 3 | Early signs can be acted on years before kindergarten | We work with children as young as 18 months |
| Nearly 4 in 10 also have an intellectual disability | Needs differ widely from one child to the next | Each child receives an individualized treatment plan |
| Identification varies by community | Where you live can affect how quickly you find help | We offer therapy at home, at school and in our centers |
Blue Gems ABA Supports Children with Autism and Their Families
The number of children identified with autism keeps growing, and so does the need for quality care. Behind each statistic is a child with strengths of their own.
At Blue Gems ABA, our team of experienced therapists uses applied behavior analysis (ABA therapy) to help children on the autism spectrum build communication and daily living skills. Every treatment plan is designed around the individual child.
To learn more, please contact us today.
Frequently Asked Questions About Autism Statistics
- What percentage of children in the United States have autism?
According to the CDC’s 2022 surveillance data, approximately 3.2%, or 1 in 31, of 8-year-old children in participating U.S. communities were identified with autism.
- Are autism rates increasing?
The percentage of children identified with autism has increased substantially since 2000. Improved screening, greater awareness and changes in diagnostic practices contribute to this trend.
- Is autism more common in boys or girls?
Autism is identified approximately 3.4 times as often in boys as in girls in the CDC’s 2022 data. Researchers are also studying whether autism is underidentified in girls.
- At what age is autism usually diagnosed?
The CDC reported a median age of 47 months for the earliest recorded autism diagnosis among children with a documented diagnosis. Autism-specific screening is recommended at 18 and 24 months.
- Do autism statistics predict whether an individual child will have autism?
No. Population statistics describe patterns across groups and cannot determine whether an individual child has autism; developmental concerns should be discussed with a qualified healthcare professional.
References
- Centers for Disease Control and Prevention. Prevalence and Early Identification of Autism Spectrum Disorder Among Children Aged 4 and 8 Years — ADDM Network, 16 Sites, United States, 2022. MMWR, 2025.
- Centers for Disease Control and Prevention. Autism prevalence by sex, 2022 surveillance data. MMWR, 2025.
- Centers for Disease Control and Prevention. Early identification of autism among 4-year-old children. MMWR, 2025.
- Centers for Disease Control and Prevention. Cognitive ability and intellectual disability among children identified with autism. MMWR, 2025.
- Centers for Disease Control and Prevention. Estimated Prevalence of Autism Spectrum Disorder in Adults in the United States, 2017.
- World Health Organization. Autism. Global prevalence estimates.
- Centers for Disease Control and Prevention. Data and Statistics on Autism Spectrum Disorder. ADDM Network historical prevalence data.
- Centers for Disease Control and Prevention. Autism prevalence by race and ethnicity in 2022. MMWR, 2025.
- Centers for Disease Control and Prevention. Geographic variation in autism prevalence across ADDM Network communities. MMWR, 2025.
- Centers for Disease Control and Prevention. Age at earliest documented autism diagnosis. MMWR, 2025.
- Centers for Disease Control and Prevention. Early identification comparison between 2014 and 2018 birth cohorts. MMWR, 2025.
- Centers for Disease Control and Prevention, National Center for Health Statistics. Births and Natality. U.S. birth statistics.
