

Applied behavior analysis (ABA therapy) is based in scientific research about how learning and behavior works. It is rooted in the concepts of Behavior Analysis (BA) and integrates many different strategies to help children with autism spectrum disorder (ASD) learn new communication, social and daily life skills, while also modifying certain negative behaviors.
At the heart of ABA therapy is the fact that treatment plans are customized to each individual patient. The goal is to target certain behaviors or skills that the child struggles with, as well as to play to their strengths and motivations to create an engaging experience.
Therapists set well-stated goals at the outset of the plan, and then track the child’s progress toward those goals as the therapy is administered. This is done so that the therapists can adjust the treatment plan as needed based on the progress.
ABA therapists collect a lot of data during therapy sessions and then, with a team of people, analyze this data to identify potential areas of strength, weakness and opportunities for growth.
To make this analysis easier and more visual, ABA therapy uses what are known as Standard Celeration Charts, or SCCs. These charts apply specifically to Precision Teaching, which is one of the teaching strategies therapists use.
Let’s take a more in-depth look at what a Standard Celeration Chart is and how it works.
What is a Standard Celeration Chart?
A Standard Celeration Chart is one of many tools that ABA therapy uses that helps professionals measure changes in behavior over a time period. These charts are a visual way of displaying this information in a graph format, which makes it easier for ABA therapy professionals to see how a child is progressing toward their goals.
SCCs were actually originally developed back in the 1960s, and they were — and still are — an integral component of Precision Teaching.
From a technical standpoint, Standard Celeration Charts are so unique because they are what’s known as semi-logarithmic. This means that it represents exponential as well as linear growth, all on the same chart.
The advantage of this is that it more accurately represents how a child’s behavior changes in time, and it’s very good at identifying large and/or rapid changes.
Overview of Standard Celeration Charts (SCCs)
| Feature | Description |
|---|---|
| Purpose | Measure behavioral changes over time in ABA therapy |
| Graph Type | Semi-logarithmic chart (represents exponential and linear growth) |
| Developed In | 1960s |
| Primary Use | Part of Precision Teaching in ABA therapy |
| Key Benefit | Helps identify large and rapid behavioral changes |
How are Standard Celeration Charts Used?
Standard Celeration Charts are used throughout ABA therapy. They can be used in whatever setting where therapy is being administered and Precision Teaching is being used. It can also be used to track changes in whatever behavior the therapist is trying to target — whether it be social, self-help, math, reading, communication or other skills.
SCCs are meant to give ABA professionals a visual representation of how each patient’s behavior is changing over time. By being able to more easily see the behavior change, the professional team can analyze whether the specific interventions that they are using are working for that child.
The charts show whether a child’s behavior is decreasing or increasing over time, and at what rate it is doing so. This allows the ABA therapy team to understand whether behaviors are changing in the right direction at all and also whether they’re progressing at the rate they had hoped.
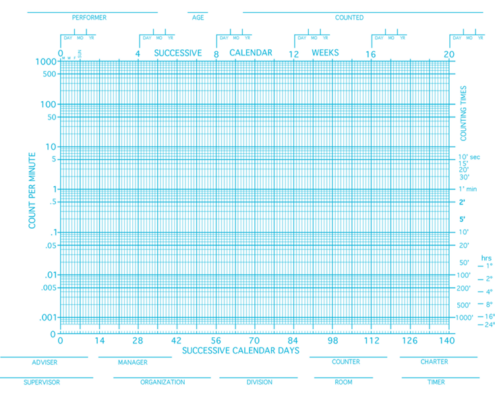
What Do Standard Celeration Charts Look Like and How Does It Work?
Standard Celeration Charts are laid out like a typical graphical chart.
On the X axis — the one that extends horizontally at the bottom — is where time is represented. On the Y axis — the one that extends horizontally on the left — is where behavior rates will be charted.
This, of course, begs the question: What does the ABA therapist chart on an SCC?
While using Precision Teaching with their patients, ABA therapists will measure how many times their patient attempts a certain skill or behavior that they’re trying to teach them. They’ll also measure how many of those attempts were perfect or imperfect.
This data is then put onto a Standard Celeration Chart so that it can be viewed in an easier way. The SCC will be a visual display of this data, then, with the ABA therapy team able to see how frequently the child is attempting skills or behaviors that are being taught, as well as how fluent (or successfully) they are with those skills or behaviors.
Based on the data collected and the information put on a SCC, the ABA therapy team can analyze whether any changes need to be made to the child’s treatment plan or whether new goals need to be set based on their progress.
Usage of Standard Celeration Charts in ABA Therapy
| Setting | Tracked Behaviors | Purpose |
|---|---|---|
| ABA Therapy Clinics | Social, self-help, math, reading, communication skills | Measure progress toward therapy goals |
| Schools | Academic skills like math and reading | Monitor learning rates |
| Homes | Daily life skills and communication | Assess improvements in independent living |
Blue Gems ABA Uses Standard Celeration Charts in Therapy Sessions
ABA therapy involves a lot of data collection. As such, accurate analysis of this data is crucial to being able to see how well patients are progressing toward their goals and whether any changes to the treatment plan need to be made.
At Blue Gems ABA, our team of professionals use Standard Celeration Charts as a major tool in our work when we’re putting Precision Teaching into practice. This helps us — and others — see just how well children with autism are progressing toward their goals of building social, communication and daily life skills, and so much more.
To learn more, please contact us today.
